 and RStudio
 [1] 25Week 1: Introduction and first steps into data analysis
POL269 Political Data Research
22.01.2024

Dr Javier Sajuria
Reader in Comparative Politics
📧 : j.sajuria@qmul.ac.uk
💻 : www.sajuria.com
📍 : ArtsOne 2.29
A&F hours: Mondays 3.30pm - 4.30pm. Book via Calendly and by appointment

Dr Elizabeth Simon
Postdoctoral Researcher in British Politics
📧 : e.simon@qmul.ac.uk
💻 : QM profile
📍 : TBC
A&F hours: TBC
Course website

Course website is: pol269.sajuria.com
Where you will find lecture slides, seminar activities, solutions.
Textbook

Elena Llaudet and Kosuke Imai. Data Analysis for Social Science: A Friendly and Practical Introduction, Princeton University Press, 2022
CAUTION: Cumulative Material

Material is cumulative: lectures later in the course assume that you know what was covered earlier in the course
Make sure to keep up with the material and take some time to review each week!
If you miss class, make sure to watch the recording
- class recordings are usually posted on the course website 24 hours after class
Questions?

R and RStudio
As part of Homework #0, you should have installed two programs in your computer:
- R
![]() and RStudio
and RStudio ![]()
- R
Ris the statistical program that will perform calculations and create graphics for us (it’s the engine)RStudiois the user-friendly interface that we will use to communicate with RWe will never open R directly; we will always start by opening RStudio (RStudio will open R by itself)
RStudio
Go ahead and open RStudio
![]()
Then, open a new R script:
- dropdown menu: File > New File > R Script
What is an
R script?- type of file we use to store the code we write to analyse data
RStudio Layout

1. Do calculations
We can use R as a calculator
- R understands arithmetic operators such as
+, -, *, /
- R understands arithmetic operators such as
Let’s ask R to calculate 20 plus 5
First, we type on the R script (upper left window):
20+5Then, to run this code: we highlight it and either manually hit the run icon
![]() or use the shortcut command+enter in Mac or ctrl+enter in Windows
or use the shortcut command+enter in Mac or ctrl+enter in WindowsGo ahead and do it
2. Create objects
R stores information in the form of
objectsIn order to analyse data, we will need to create objects
An object is like a box that can contain anything
![]()
To create one, we need to:
give it a name
specify its contents
use the assignment operator

3. Use functions
- Think of a function as an action that you request R to perform on a particular object or piece of data, such as calculating the square root of 25

AN R FUNCTION
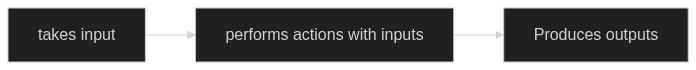
- A
function: + takes input(s)- example: takes the number 25
- performs an action with the input(s)
- computes \(\sqrt{\textrm{25}}\)
- produces an output
- produces the number 5
The following code would ask R to bake a cake mix for 30 minutes at 350\(^{\circ}\)F, so that we can have cake as the output:

Today’s lecture
Introductions and Housekeeping
R and Rstudio, scripts, console and the environment
R calculations, objects, functions
Next lecture
What are data/datasets?
What is an observation
What is a variable
Types of variables on content
How to load and make sense of data
Computing and interpreting means
